Continued from Part I.
In an interview with Frontier Enterprise, TigerGraph CEO Yu Xu talks about semi-structured data retrieval, the organisation’s plans for an IPO, TigerGraph use cases, and the way forward in graph databases.
How does a large enterprise with a traditional relational database – or even some sort of MapReduce Hadoop architecture – migrate to a graph database? How long does it take? Do you do a proof of concept first?
We do proof of concept (POC) or proof of value. Actually, a lot of the time, for customers, the number one reason they like TigerGraph is unloading speed. If a customer has one terabyte or two terabytes of data and tries other products, they will take days or weeks to finish – or they cannot finish at all because everything crashes.
With TigerGraph, they will finish in two hours. Recently, Microsoft Xbox chose TigerGraph and became a paying customer. They use terabytes of data through TigerGraph in the POC so quickly, and they cannot do this with anything else.
Back to crashing, we can know the tables, and we can know the space with text files for initial, one- time-only loading. In real time, we listen to Kafka queues and listen to other information bars so we can get real-time updates. The beauty of TigerGraph is that our database is alive, is immutable, and you can update the graph anytime. We also have a standardised API, a RESTful API. You can use Python, Java, JavaScript, or any language. You can post through the standardised RESTful API, then get updates immediately.
There are many ways for customers to ingest data into TigerGraph. A lot of customers are amazed. ‘You finished loading? Seriously?’ Because, again, we cooked C++ in our system. Yeah, that’s the magic.
We saw that with the comparison between Neo4j and TigerGraph, the loading speed for TigerGraph is faster than Neo4j. That’s one of the advantages, right?
Yeah, especially for bigger data. For small quantities of data, customers don’t care too much. But now, with the data explosion, you want your product technology to be future-proof. Even if you have more data today, you will definitely have even more data year after year.

Is there any sort of route towards IPO?
Definitely, that’s one part of the plan. But if you look at the MongoDB valuation created, I think, more than 10x or 50x, now, you will continue to grow the business. For TigerGraph, we are growing. The graph market is super hot, we are the leader in this space, so an IPO is definitely one milestone.
But what we are also doing is more than a simple distributed graph database. We’re doing machine learning AI public graphs, graph features, and graph neural networks. Graph algorithms are so useful to machine learning and data scientists, right? So that’s a huge market. As we all know, motion in UI is so big, right?
We’re also doing more around the graph BI. If you look at the top, Maxwell, Microsoft Power BI, it’s a huge market because people can use UI to ask questions. You don’t need to manually write down SQL queries, but you have to remember the syntax and everything. It’s just more productive using UI to ask questions and then the system automatically generates the SQL query for you against the database.
Similarly, TigerGraph has a product called Visual Query Builder. It’s very similar to Tableau but dedicated to graph analytics. It’s web browser based; you can just ask questions visually. Just drag and drop, make a few clicks, then ask a question like: ‘Okay, who are my suppliers in this city, also apply? You can select a path in a small tree pattern, and you just join. Then it automatically generates the query for you, or gives you the answer in real time.
It’s almost like you’re competing with Tableau.
We were also partners with them. We met Tableau to create a typographic database versus a traditional relational base. But of course, the prevalent database cannot ask a graph type of question. The reason people want to use the TigerGraph, which requires a builder, is because they can ask questions that they cannot with BI tools. We don’t want to reinvent the wheel, so the graph, which requires a builder, is reading for advanced analytics.
The last direction we’re going is in industry solutions. There are so many applications like supply chains and power grids that are really intuitive to people with graphs. We see enough common data points of success from customers. Now they’re building total, packaged solutions on top of TigerGraph. We are starting from the supply chain, and anti-money laundering (AML) and fraud detection for banking and financial institutions. So we are not just selling a graph database, but also the solution, the UI, and the dashboarding on top of that.
The verticalised use cases are something that’s coming up.
Yeah, we’re doing this already. We already have AML through integration with a partner. We were also making an application for Data 360, as well as for supply chains.
You talked about information retrieval in semi-structured data. Could you talk a little bit about that? Why is that an area of interest? What is the most interesting part of what’s happening there?
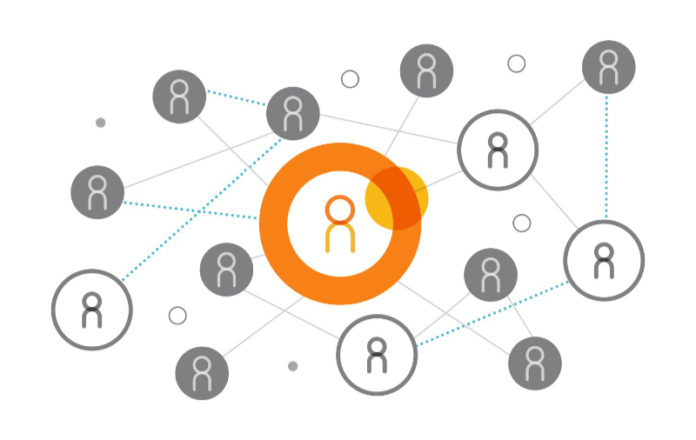
Yeah, so graph schema is flexible; that’s why it’s appealing to a lot of developers. Because you can handle semi-structured data, like you just mentioned. The relationship is technically a bit more rigid. It’s not easy to change the schema. Once you load the data, it’s not easy to change it. For graphs, it is more flexible. Tabular data is two dimensional, right? You have columns and rows. A graph, on the other hand, has unlimited dimensions.
For example, in a company, you have a reporting structure, which is just one dimension. you can put in a graph schema. And when we sit here, we’re in this room, we’re in this building, which is part of the city, and this city is part of this region. You can see that even for geography, you have a hierarchy. You can put this in a graph, and the graph can capture this relationship.
When talking about the time dimension, each year normally has 365 days, and each day has only 24 hours. You can put an interval as imagined in the graph. You are able to capture all kinds of dimension data in a single graph schema. You can also search in parallel. From a certain time to another time; in this location, in other locations. What’s my inventory? What does my social network look like? What does my supply chain look like? In a single graph, you can capture all kinds of dimension data, and then you’re able to connect different data sources to move. That’s why graphs are so useful to a lot of new applications.
We can also be more helpful to some applications using NLP (natural language processing) or text search, because you need context. If you need more intelligent AI, you need context. Gartner talks about contextualisation, that’s the key for machine learning and AI. Graphs can connect all these data points in a few steps. We can give you more information, give you the best context for personal commendations, for fraud detection, for any kind of business decision. Graphs can be the foundation for machine learning and AI. It’s the next data management for machine learning and AI.
What is the way forward? How do you see this market evolving? How do you see TigerGraph evolve over the next 5, 10 years? What are the most interesting innovations they’ll come up with in the graph database ecosystem?
I think it’s going in a few directions. I think what’s going to be new is more hardware-accelerated innovation. For example, we’re working with Intel, which created a new specialised CPU dedicated to random access, which is great for graphs. And we’ll see more such innovation from CPU manufacturers like Intel and AMD.
Another way is more about BI. I think it’s so exciting that more innovation should happen. Because graphs are still kind of new, but if we have an even better, easy-to-use UI, then people don’t need to become experts in graph algorithms and graph theory. You just ask questions; it’s just like when kids play on iPads? They can just use it intuitively. Similarly, our goal is to make sure that graphs are going to be easy to use. You don’t need to write anything; simply drag and drop. With this, many innovative applications will happen.


