It’s common for companies to eventually amass a considerable number of disconnected software tools, with at least one for every part of their infrastructure and application stack. This results in tool sprawl, which is likely to lead to higher operating costs and more complexity in troubleshooting problems.
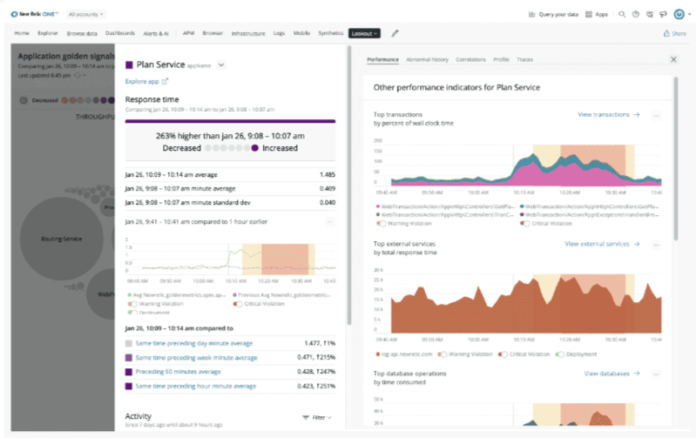
Because complicated stacks are typically not woven together in a streamlined way, there is a need for enterprises to use an integrated toolset with a consistent interface across infrastructure, applications, various data types, and the user experience. New Relic One is an observability platform that seeks to solve that problem by collecting and contextualising operational data from various sources.
According to Shubham Srivastava, Chief Technology Officer (CTO) at digital media firm Hindustan Times Digital Streams (HTDS), New Relic One helped his organisation achieve full-stack visibility in their applications. With the platform, they can now instrument, visualise, analyse, and troubleshoot their technology platform in a connected application. This, he said, has resulted in higher performance, agility and high frequency in deployments, as well as operational controls while running high-scaled applications.
Improved KPIs

The implementation has helped developer productivity in HTDS as well. “With real-time instrumentation of key performance metrics and the integration of New Relic across various back-end and front-end layers, it’s become easy for faster troubleshooting while being proactive on operational key performance indicators (KPIs),” said Srivastava.
The improved HTDS KPIs include mean time to repair (or MTTR), and product quality, which is said to result in a better product experience.
“We started with using New Relic Application Performance Monitoring (APM) to keep track of the performance and availability of applications. But gradually, as we tried using other products, we decided to sign up for New Relic One, which has given us access to a great observability platform,” he shared.
New Relic has various agents and integrations to offer, which Srivastava says are easy to integrate with most of the components of HTDS applications.
“Our performance engineering initiatives have delivered substantial results in improving our Web Vitals, high throughput across back-end applications, and product experience across low bandwidth networks,” said Srivastava. “Beyond performance, we are shifting gears on our container deployments, making it distributed and efficient while ensuring scale and high availability.”
Delivering actionable data

New Relic One isn’t the only observability platform out there, but Michael Fleshman, CTO – Asia Pacific & Japan at New Relic, claims theirs is unique because of the “richness” of data that their product can bring in, and the ability for businesses to take action from that data.
“If you look at some of our competitors, they’re limited in the data that they are able to ingest from different business resources,” said Fleshman. “It tends to be very infrastructure-oriented or application-oriented. With New Relic, you can actually mix in metrics from other parts of the business, allowing users to create views and dashboards that relate to how the business, product, and customer are being impacted,” he said.
“And then there’s programmability, which allows users to create custom ways of looking at data and integrating it,” noted Fleshman. “This allows businesses to view their data in different ways for different stakeholders, and relate it directly to business outcomes and impact. In addition, if there’s an issue related to the customer experience, users can drill down at an application level to identify and rectify it,” he explained.
Fleshman noted that HTDS has “very aggressive” growth targets and strategic business priorities. “They want to dive deep into the data to understand how they can innovate and grow, as well as continue to improve reliability and performance. Some of the benefits that the HTDS team are seeing through New Relic One include real-time operational efficiency, performance engineering matrices, and faster development cycles,” Fleshman said.
This, Fleshman claims, has resulted in far fewer support tickets.
“When HTDS first started using New Relic, they deployed our APM product to monitor application performance,” he said. “They then decided to deploy some of our other products, and shortly thereafter dove straight into New Relic One to gain full access to every product on the platform. At the time, this was quite a typical approach – starting out with our APM product, and then deploying others later down the track,” shared Fleshman.
Customer customisation
When asked what were some of the customisations involved for most organisations, Fleshman said: “I wouldn’t say there are common customisations per se, but instead a common pattern of what our customers want to customise. Our customers tend to want to create dashboards and visualisations for many ‘non-tech’ stakeholders. Examples include executive dashboards (both business and CTO), and operational and funnel management dashboards. These usually blend typical New Relic MELT (Metrics, Events, Logs and Traces) data with other custom business and operational data and metrics,” he revealed.
“At a product level, beyond the fundamental dashboard customisations, New Relic Workloads are ‘customisations’ that allow teams to group entities together along shared themes. In this way, teams can visualise their applications and overall systems in ways that are specific to their responsibilities or context,” Fleshman concluded.


